All published articles of this journal are available on ScienceDirect.

A Longitudinal Analysis of CD4+ T-Cell Count Dynamics in Treated HIV-Infected Individuals in the United States
Authors Info & Affiliations
Abstract
Introduction
Few published reports describe individual trajectories or heterogeneity in CD4+ T-cell count trends over time among virologically suppressed people living with HIV (PLWH).
Methods
We conducted a retrospective cohort study using administrative health claims among adults aged 18-65 years with a viral load of ≤ 200 copies/mL between January 1, 2012, and June 30, 2022. Among individuals with at least four CD4+ T-cell measurements, we described the proportion of individuals with both transient and sustained changes in cell counts of more than 30% overall. We stratified by baseline CD4+ T-cell count.
Results
A 30% increase or decrease from baseline was observed in 48.2% and 18.8% of individuals at a mean of 53.0 and 55.6 weeks of follow-up, respectively. Of people with a 30% decrease, 38.4% had at least two subsequent T-cell counts, and 24.3% did not return to within 30% of their baseline value.
Discussion
CD4+ T-cell counts continue to vary significantly after a year of suppressed viral load among people living with HIV. The proportion of PLWH with more than a 30% increase was more than twice that of those with more than a 30% decrease; a sustained decrease in CD4+ T-cell count was observed for 1.8% of the full cohort while they continued to be virally suppressed.
1. INTRODUCTION
Among people living with HIV (PLWH), CD4+ T-cell count/mm3 is used to assess HIV disease progression and immune restoration. As with many clinical biomarkers that are influenced by a multitude of factors, interpreting changes in these biomarkers over time poses challenges to clinicians. Interpretation among PLWH is more difficult, as there is additional complexity because the virus itself impacts these counts, depending on, among other factors, nadir CD4+ T-cell count/mm3, time on antiretroviral treatment, and treatment regimen [1-3].
Many studies report trends in population average cell counts after starting antiretroviral therapy (ART). These studies generally find increases in CD4+ T-cell count/mm3, describing ‘restoration’ of CD4+ T-cell count/mm3. Trends are often stratified by CD4+ T-cell count/mm at diagnosis, age, or ART regimen [3-10]. In contrast, few published reports describe individual trajectories or heterogeneity in CD4+ T cell count changes over time among virologically suppressed PLWH (reviewed in Ford et al., 2015) [11]. It is not well understood whether there are individuals with non-monotonic trajectories or even a decline after an initial increase. One large study assessed the decline of CD4+ T-cell count/mm3, but used a stringent definition of dropping below 200 cells/mm, regardless of the count at the beginning of observation [11]. Heterogeneity in CD4+ T-cell count trajectories may be masked by population-averaged changes.
Here we describe CD4+ T-cell count/mm3 among PLWH with suppressed viral load over time from a large database of electronic health records (EHRs). We report the proportion of people with over 30% change from the baseline, and those returning to within 30% and 10% of the baseline.
2. MATERIALS AND METHODS
A retrospective cohort study was conducted with a study period of 1 January 2012 - 30 June 2022 using Optum’s de-identified Clinformatics® Data Mart Database (US administrative health claims database). The cohort entry date (i.e., index date) was the date of the first viral load (VL) test result ≤200 copies/mm3 during the study period. Baseline CD4+ T-cell count was the first available CD4+ T-cell count/mm3 on or after the index date.
Inclusion criteria were age 18-65 years at index date; prevalent HIV diagnosis on or before the index date; ≥2 CD4+ T-cell counts ≤ 27 months apart, and viral load of ≤ 200 copies/mm3 during the study period. Individuals with conditions documented prior to or during the study period known to affect lymphocyte counts, such as pregnancy, cancer, kidney disease, liver disease, non-HIV immune deficiency, or organ or tissue transplant, were excluded. Participants were censored at the first incident of one of the following: end of the study period, last recorded CD4+ T-cell count/mm3 within the study period, viral load >200 copies/mm3, >27 months between CD4+ T-cell measurements, new diagnosis of an excluding condition, or end of continuous enrollment in the database.
Among individuals with at least 4 CD4+ T-cell measurements (and therefore sufficient follow-up to observe both transient and sustained changes), we described the proportion of individuals with changes in cell counts of more than 30%. We calculated the proportion of people whose counts did not return to within 30% of the index value during follow-up after the 30% change, overall and by baseline CD4+ T-cell count/mm3. Baseline CD4+ T-cell count categories were based on World Health Organization immunological classifications (<200, 200-349, 350-499, and 500+ cells/mm3) [12].
3. RESULTS
Of 19,884 eligible participants, 85% were reported as male and 15% as female, with a mean age of 47 years (Table 1). The mean total CD4+ T-cell count at baseline was 651 cells/mm3. A mean of 882 days and a median of 630 days were spent in the cohort, with a mean of 5.8 and a median of 4 CD4+ T-cell counts measured per participant.
| - | All | <200 CD4 T-cells/ mm3 |
200-349 CD4 T-cells/ mm3 |
350-499 CD4 T-cells/ mm3 |
≥ 500 CD4 T-cells/ mm3 |
| n=19,884 | n=1,146 | n=2,103 | n=3,443 | n=13,192 | |
| Age in years, mean (SD) | 46.5 (10.95) | 47.4 (10.43) | 47.5 (10.80) | 46.7 (10.91) | 46.1 (11.01) |
| Days in cohort, mean (SD) | 882 (787) | 729 (698) | 827 (764) | 909 (805) | 897 (791) |
| No. CD4+ T-cell counts, mean (SD) | 5.8 (4.8) | 5.6 (4.5) | 5.8 (5.0) | 6.0 (4.9) | 5.8 (4.8) |
| Sub-set with at least 4 CD4+ T-cell counts | n=11,136 | n=633 | n=1,146 | n=1,970 | n=7,387 |
| Baseline CD4+ T-cell count, mean (SD) | 650.2 (312.9) | 133.0 (48.0) | 284.6 (42.3) | 431 (42.1) | 809.7 (254.4) |
| Age in years, mean (SD) | 46.9 (10.7) | 47.7 (10.5) | 48.0 (10.4) | 47.2 (10.6) | 46.6 (10.8) |
| Days in cohort, mean (SD) | 1167 (720) | 982 (652) | 1080 (700) | 1186 (734) | 1191 (722) |
| No. CD4+ T-cell counts, mean (SD) | 7.5 (3.7) | 7.3 (3.5) | 7.4 (3.6) | 7.6 (3.8) | 7.5 (3.7) |
| AND ≥ 30% drop from index value, % | 18.8 | 10.6 | 12.2 | 12.5 | 22.2 |
| Baseline CD4+ T-cell count, mean (SD) | 765.3 (348.9) | 143.2 (44.3) | 276 (45.2) | 432.6 (42.3) | 882.8 (296.9) |
| Time to first value ≥ 30%, weeks | 55.6 | 28.2 | 49.9 | 62.1 | 57.6 |
| Those with a 30% drop AND 2+ counts after drop, % |
38.4 | 43.3 | 27.9 | 32.8 | 40.0 |
| Percent of those with a drop AND 2+ counts after drop AND no return to within 30% of the index value, % |
24.3 | 27.6 | 25.6 | 30.9 | 23.3 |
| AND ≥ 30% increase from index value, % | 48.2 | 87.0 | 72.3 | 62.5 | 37.3 |
| Baseline CD4+ T-cell count, mean (SD) | 528.5 (260.3) | 130.3 (48.9) | 282 (42.1) | 429.7 (41.9) | 726.3 (191.5) |
| Time to first value ≥ 30%, weeks | 53.0 | 28.6 | 43.9 | 52.4 | 66.0 |
| Those with a 30% increase AND 2+ counts after increase, % |
67.0 | 87.1 | 80.3 | 70.1 | 57.6 |
| Percent of those with an increase AND 2+ counts after increase AND no return to within 30% of the index value, % |
37.0 | 73.1 | 47.4 | 34.1 | 23.4 |
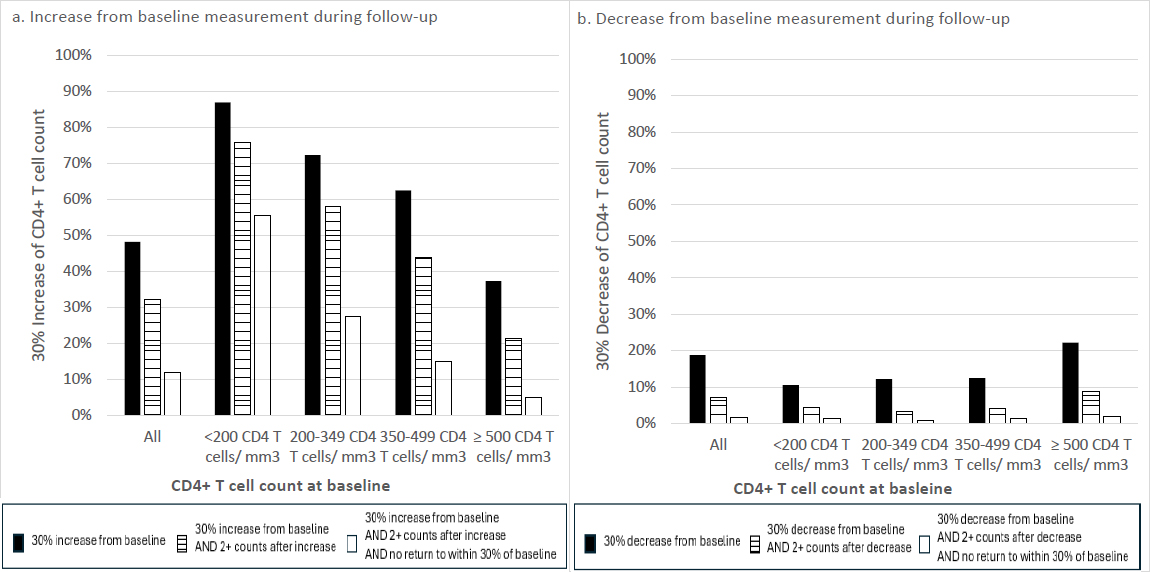
Proportion of cohort meeting CD4+ T-cell change criteria during follow-up.
The subcohort of 11,136 individuals with ≥ 4 CD4+ T-cell counts measured during the study period had a similar mean age and distribution across categories of CD4+ T-cell count at baseline (Table 1). A 30% increase from baseline was observed in 48.2% of individuals at a mean of 53.0 weeks of follow-up. A 30% decrease in CD4+ T-cell count/mm3 was recorded for 18.8% of PLWH at a mean of 55.6 weeks after baseline (Table 1 and Fig. 1). When stratified by baseline CD4+ T-cell count of <200 and ≥500 cells/mm3, 10.6% and 22.2% dropped at least 30% from their baseline value during follow-up, respectively (Table 1 and Fig. 1). In general, participants with higher baseline CD4+ T-cell counts were more likely to show a 30% decrease, and less likely to show a 30% increase, than participants with lower baseline CD4+ T-cell counts. To explore whether the CD4+ T-cell count changes were temporary or sustained, a subset of people with a 30% change who remained in the cohort for ≥2 subsequent counts is also described (67.0% and 38.4% for decrease and increase, respectively). For 37.0% and 24.3% of these individuals with increases and decreases, respectively, their CD4 T-cell counts did not return to within 30% of the baseline value (Table 1 and Fig. 1).
4. DISCUSSION
These data provide descriptions of CD4+ T-cell counts from a large cohort of PLWH in the US with suppressed viral load in the current era of antiretroviral therapy [13]. As previously well described, the CD4+ T-cell count of the vast majority of participants with index counts below 200 cells/mm3 increased by more than 30%, while the remaining participants either decreased or remained the same. These results are in line with previous studies that have demonstrated incomplete recovery of CD4+ T-cell count [8].
The description of the proportion of individuals who maintain viral suppression but have a sustained decrease in CD4+ T-cell count is less understood. A previous meta-analysis [11], found 0.4% of people dropped below a threshold of CD4+ T-cell count (200-350 cells/mm3). However, a CD4+ T-cell count of 350-500 cells/mm3 was required to enter the cohort, and other reasons for the decline were not excluded (e.g., chemotherapy). In this cohort of people with suppressed viral load, participants were included at all baseline CD4+ T-cell counts and were censored at a VL over 200 copies/mm3. Time since diagnosis and treatment history, however, were unknown. Approximately twice as many participants had a 30% drop in CD4+ T count if their baseline count was ≥ 500 cells/mm3 than <200 CD4 T-cells/ mm3, though the proportions of those participants with a 30% drop who had 2+ additional counts and did not return to within 30% of baseline were similar between groups. This could suggest that more participants in the lowest count group were diagnosed more recently, and the larger proportion with an increase was reflective of initial immune recovery [3].
Changes in CD4+ T-cell count reflecting recovery upon initiation of antiretroviral therapy or correlating with viral rebound are well established biomarkers for clinical care of PLWH, yet the CD4+ T-cell count itself has also been associated with life expectancy and clinical events [14, 15]. These results from the modern HIV treatment era in the United States support the potential value of monitoring CD4+ T-cell counts irrespective of viral load for some portion of PLWH, and more research should be conducted to further characterize CD4+ T-cell count during viral suppression and any correlations with clinical outcomes.
5. STUDY LIMITATIONS
Real-world EHR data have limitations, including likely incomplete HIV disease and treatment history; missing laboratory or clinical data; and variability in clinic visits and laboratory tests due to access to care (including social determinants of health) and health status. Additionally, ICD-9 and ICD-10-CM diagnoses may lead to misclassification and incorrect inclusion or exclusion of eligible patients. Thus, the generalizability of the study results should be interpreted with caution. These objectives should be further explored in cohort databases with more complete disease courses and clinical information.
CONCLUSION
While most studies report population averages and rare drops in CD4+ T-cell counts with maintained viral suppression, there is considerable heterogeneity in CD4+ T-cell count trajectories among PLWH with suppressed viral load, and more studies should explore the causes or biomarkers and the health impacts.
AUTHORS’ CONTRIBUTIONS
The authors confirm their contribution to the paper as follows: P.K., R.ES.: Study conception and design: M.K., J.T., L.Z.: Analysis and interpretation of results. All authors reviewed the results and approved the final version of the manuscript.
LIST OF ABBREVIATIONS
| CD4+ T-Cell | = Thymus Cells with Cluster of Differentiation Protein 4 on the Surface |
| HIV | = Human Immunodeficiency Virus |
| PLWH | = People Living With Human Immunodeficiency Virus |
AVAILABILITY OF DATA AND MATERIALS
All data generated or analyzed during this study are included in this published article.
ACKNOWLEDGEMENTS
Declared none.